Across major international markets, employees in technical positions are more likely to participate in long-term incentive programs — and receive higher award values from it.

Technology companies are more willing to offer long-term incentives, and in larger amounts, to their employees working in technical jobs, which we define as those that typically require a Bachelor of Science degree (or higher) in engineering or computer science, compared to non-technical employees (e.g., marketing, sales and finance) with similar levels of responsibilities in the organization. These technical positions generally require skill sets that are at a premium because of the competitive marketplace in the technology sector right now. The spread of digital mobility and enabled devices (i.e., the Internet of Things) is also increasing the prevalence of technical positions at companies not traditionally defined as part of the core technology sector.
It's widely understood within the HR and compensation field that technical job roles are more likely to feature equity compensation. But we wanted to see exactly how much of a premium in equity values and eligibility these types of roles receive compared to non-technical positions across a mix of foreign markets.
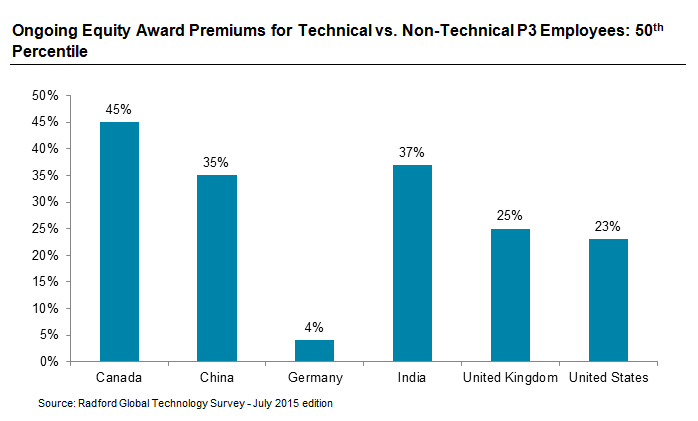
In our analysis, we looked specifically at the professional individual contributor role at a job level 3 (P3)— a mid-career level for most individuals— in the Radford Global Technology Survey. We then separated P3 jobs between the technical and non-technical classifications. Of the employees that received long-term incentives (LTI), we examined the local currency amount for technical and non-technical employees and calculated the percentage of difference between the two.
As the chart below illustrates, technical employees received higher amounts, at the midpoint, of long-term incentives compared to non-technical employees in each of the countries we looked at. The highest premium is in Canada with technical workers receiving 45% more in long-term incentives at the median. The lowest premium is 4% in Germany.
Equity Eligibility
If we take a step back and examine employee eligibility for long-term incentives, we find the equity premium for technical employees still exists in most markets, but it is not as prominent as equity receipts and actual value amounts. Our data reflects what technology firms are well known for: a more broad-based approach in their equity eligibility for different job positions. It’s also easier from an administrative standpoint to make a position eligible for equity and choose not to award LTI than to close off the option of awarding equity.
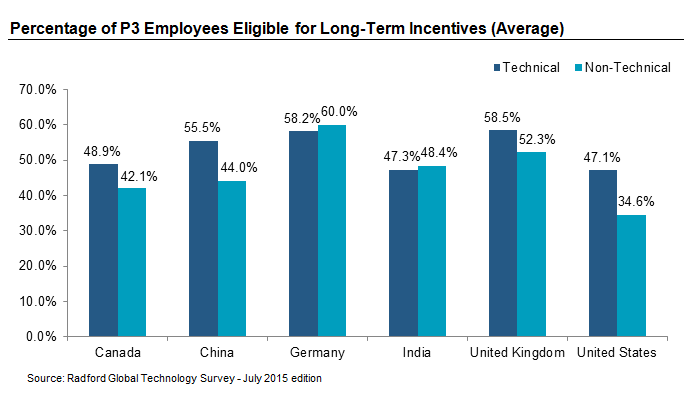
India and Germany are the only countries where the P3 non-technical position has a higher rate of LTI eligibility than the P3 technical role, although the gap is small at 1% to 2%. The difference in the percentage of technical employees that are eligible for LTI compared to non-technical ranges from 6.2% in the UK to 12.5% in the US.
As we stated above, equity eligibility will always be higher in organizations compared to the actual receipt of equity. Eligibility rates can reveal the percentage of companies in different countries that don’t plan on granting any long-term incentives for the P3 position— but equity receipt levels are even more suggestive of the premium technical employees receive.
Receipt Rates
At the receipt level, we see larger equity premiums for technical employees compared to eligibility. In every major market we look at, except for Germany, a higher percentage of technical employees received LTI compared to non-technical employees at the P3 job level. The difference in the percentage of technical employees receiving ongoing long-term incentives based on our most recent survey data ranges from 4.0% in Canada to 9.6% in the United States (US). It’s interesting to note that, aside from the United Kingdom (UK), less than half of the work force at the P3 job level— regardless of the job role— received any form of long-term incentives.
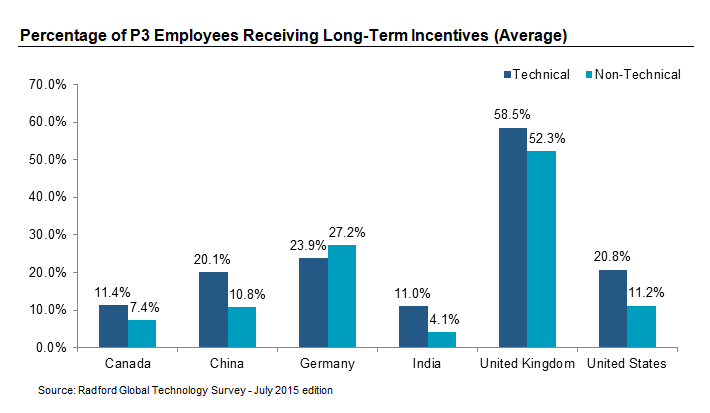
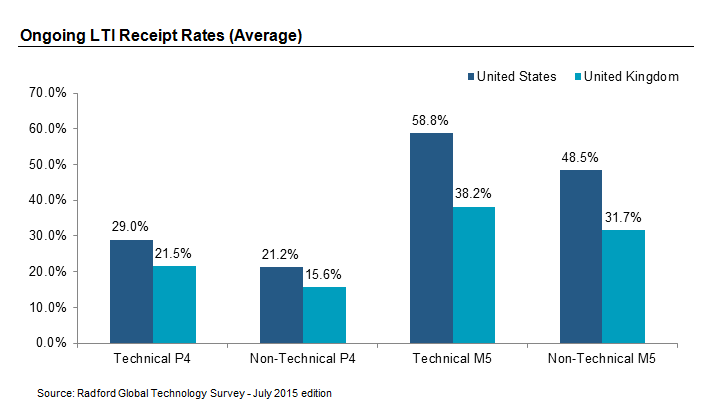
Technology companies in the US tend to have the highest level of equity in their employee pay mix, but for P3 jobs, firms based in the UK awarded LTI to a higher percentage of their staff. To explore this a little further, we examined other job levels, including P4 and Manager Level 5 (M5). At higher job levels, US-based technology companies are more likely to grant LTI. The UK market appears to be more broad-based in their equity usage compared to the US at lower job levels. But as job levels climb, US companies grant long-term incentives to a greater percentage of their employees.
Next Steps
The premium in equity granted to technical employees is a reflection of the supply and demand in the current job market. Skills such as software programmers, developers and engineers are in high demand as so many corporations, from retailers to automakers, are boosting their digital business and bringing these skills in-house.
With many employees currently holding unvested "in-the-money" equity awards, typically in the form of restricted stock, larger awards are required to attract or retain key technical employees, relative to the amounts held at the bottom of the recession.
To learn more about participating in a Radford survey, please contact our team. To speak with a member of our compensation consulting group, please write to consulting@radford.com.
Related Articles