A recent project with a medical device client highlights the importance of assessing your CEO pay ratio relative to the right set of peers before attempting to tell your story to shareholders.

When it comes to calculating the ratio of pay between your CEO and median employee, your industry, geographic footprint, and the composition of your workforce can have a huge influence on the results. Most people involved in executive compensation know this intuitively, but communicating how these factors actually affect your company’s CEO pay ratio still isn’t easy. You need both internal and external inputs to paint the full picture.
With this in mind, we asked one of our mid-sized medical device clients if we could share their story publicly in a blind case study. In their specific case, we discovered that revenue size has an outsized influence on CEO pay ratio outcomes at medical device companies, and discovering this crucial insight paved the way for developing a cohesive narrative around their CEO pay ratio.
Finding the Right Lens for Our Client
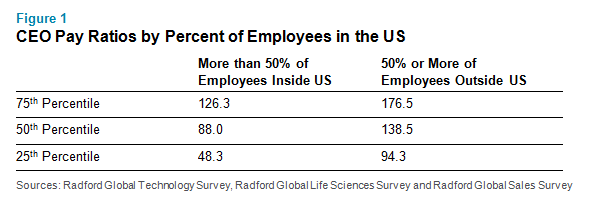
In past articles, we’ve shown how CEO pay ratios at technology and life sciences companies can be heavily influenced by the location of employees. Per Figure 1 below, at firms where 50% or more of the workforce is located outside the United States (US), the ratio of CEO pay to the median employee is 138.5. At firms where more than 50% of workers are located inside the US, median pay ratios drop to 88.0. In general, as the share of employees located outside the US increases, compensation for the median worker declines and CEO pay ratios climb. Of course, these trends can accelerate or decelerate based on the specific location of non-US employees.
In the case of our client, we set out to find similar points of distinction within the medical devices industry using custom cuts of compensation data from the Radford Global Life Sciences Survey. As we noted above, we discovered that revenue size plays a major role in CEO pay ratio outcomes for medical device firms. At roughly the $1 billion revenue mark, medical device companies typically begin to ramp up their overseas manufacturing efforts and CEO pay ratios jump up noticeably as a result. We already knew that workforce composition mattered a great deal, but finding a revenue-based inflection point was a new finding specific to this industry.
Fine-Tuning Our Client’s Story
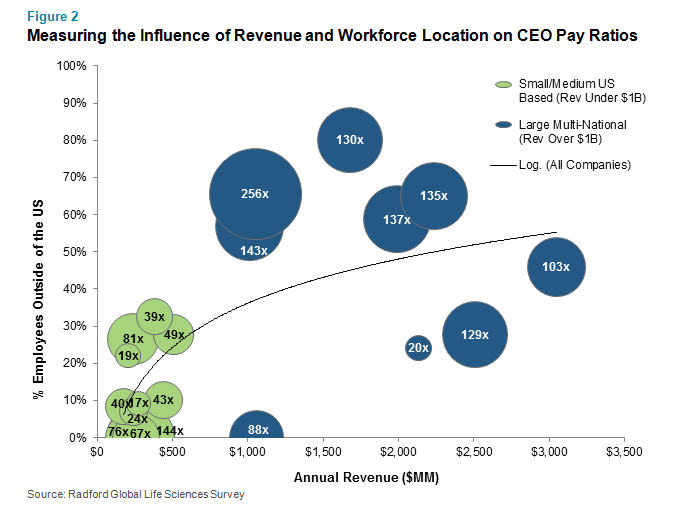
Our first attempt at assessing the size of our client’s CEO pay ratio relative to the market looked at their regular compensation peer group. The results of that study suggested their ratio was at the upper end of industry peers. However, knowing the role that revenue size plays, we next took a more focused approach, looking only at peer companies within a much tighter revenue range. The elimination of smaller peer companies created a new set of peers with far more similar workforce compositions with respect to US vs. non-US workers. Figure 2 below illustrates the clear distinction between peers above and below the $1 billion revenue threshold, both in terms of workforce composition and CEO pay ratios.
Within the context of a peer group more reflective of our client’s revenue size and workforce composition, the client’s CEO pay ratio aligned more closely to the median of the market. Most importantly, the client now had data-driven research to clearly explain their compensation benchmarking peer group (while still highly relevant from a talent competition standpoint) was not necessarily the best group to use when assessing the relative size of CEO pay ratios. The client also felt more comfortable with how they might want to explain to shareholders why a CEO pay ratio over 100 made sense for a business of their size and geographic footprint, even though some of their well-known competitors with mostly US-based employees were likely to report CEO pay ratios between 60 and 80.
Next Steps
As you begin calculating your company’s CEO pay ratio and think through how you might want to portray your story in additional narrative disclosures (if any), we recommend analyzing how your pay ratio compares to your peers. Of course, as the case study above shows, finding the right peers along industry, company size and workforce composition lines is an intensive process that involves running the numbers multiple times. Doing this work well ahead of releasing your proxy filing will give your company time to build a narrative in-tune with the realities of your business. In the case of our client, determining how a certain revenue threshold impacted CEO pay ratio outcomes was critical in narrowing down the scope of relevant peers and in building appropriate talking points for shareholder conversations.
While proxy advisory firms and most institutional investors have yet to explain how they will evaluate CEO pay ratios— in particular, when comparing ratios to other companies— organizations that take a proactive approach to this analysis and explain their rationale will be well positioned to answer concerns as they arise.
If you have questions about the Securities and Exchange Commission’s CEO pay ratio rule or would like assistance in complying with the rule, please write to consulting@radford.com.
Related Articles