When it comes to assessing the alignment between pay and performance in your sales compensation plan, there are three big buckets of quantitative analyses you should consider.

Whether your sales compensation plan is brand new or several years old, it’s important to monitor the relationship between pay and performance on a regular basis, at both an organizational and individual level. While there are numerous ways to explore this mission-critical issue, in our experience, clients are usually best served by starting with the three core buckets of quantitative analysis as follows:
Examine Overall Performance Trends
The first place to start your assessment is to review whether your company’s performance results are trending with overall business objectives and your plan’s key performance measurements. Questions to ask might include:
- Are revenue and profit levels growing at expected rates?
- Are expected shifts in product mix evident?
- Is there an increase in sales to new accounts?
If your company’s results aren’t what you’d hoped for, your sales incentive plan likely isn’t the only, or even primary, culprit. You’ll need to dig a bit deeper to find the true cause. However, for the purpose of assessing the effectiveness of your sales compensation plan, it’s good to look at whether your performance measures continue to align with your company’s strategic imperatives.
Conduct a Team-Wide Analysis
Next, consider the aggregate cost of your incentive compensation relative to budget and performance. There are a number of different ways to analyze this type of data, including:
- Effective commission rate (otherwise known as compensation cost of sales)— How much of each revenue dollar is allocated to incentive pay? How is that cost allocation trending relative to past budgets and performance? Increases in this area could speak to purposeful investments you’re making in your sales organization, whereas, at other times, accelerating spend might not be sustainable given other investment priorities in your organization.
- Incentive pay dispersion — Does the dispersion between your 90th percentile and 50th percentile payout levels approximate the plan’s upside leverage multiple (i.e., the percent of the target incentive the plan pays for “excellence” performance)? In high-growth technology companies we expect excellent performance to yield a 3x or higher multiple on the target incentive for exceptional performance.
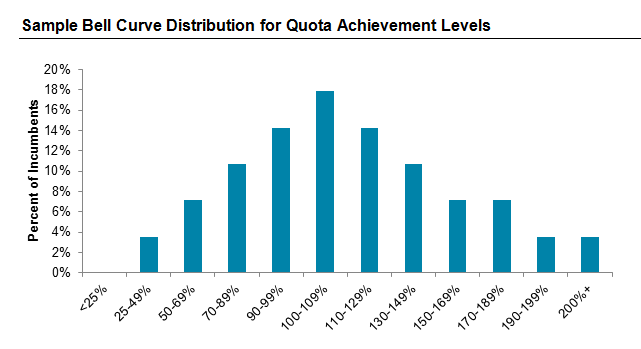
- Performance range integrity — Analyze quota achievement levels to determine whether there is a motivating and cost-effective range of performance. An ideal range, when the company hits its sales target, is 50% to 60% of sales reps at or above quota, 10% of reps at or above “excellence,” and only 5% of reps below the minimum performance threshold. If your quota achievement levels don’t follow a bell curve, it could point to a fundamental quota-setting problem. The chart below, which is a sample distribution bell curve for quota achievement levels, is indicative of a healthy dispersion of achievement levels across the sales organization.
- Incentive component breakdown — Is the percentage of total incentives paid by each incentive component aligned with the relative weighting the plan assigns to each component? In other words, are reps earning their incentive pay where you intended them to vis-à-vis the plan design? If not, then you should consider potential changes to the components of your incentive plan (e.g., equity vehicles, short vs. long-term payouts, etc.) to encourage desired selling outcomes.
Perform an Incumbent-Level Analysis
If steps one and two above reveal issues, getting down to the root cause of problems often requires taking a micro view. For our sales compensation plan that means understanding results at the individual employee level. Here are some helpful ways to look at data from a micro level:
- Sales force ranking — Segment your individual sales team incumbents by role and/or position, then sort incentive payout results from high to low. Do payout amounts actually fall in line with what sales managers believe are the relative contribution levels of each incumbent?
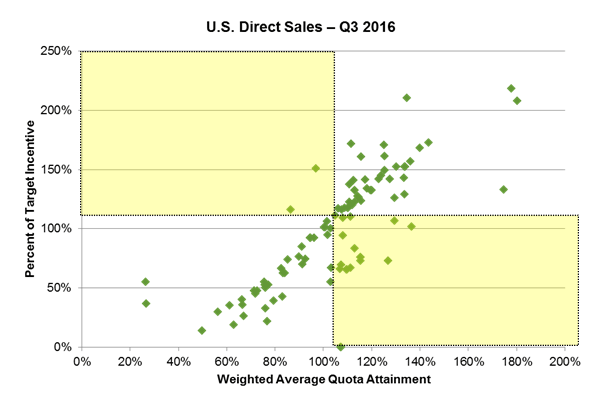
- Performance and pay correlation test — This type of test usually ends up as a scatter plot (see the illustrative example below) and can be particularly enlightening when calculating performance using the weighted average results from employees on a multiple-component plan. Look for employees plotted along the chart with similar levels of pay but widely-disparate performance scores. Overlay a two-by-two matrix, and highlight those employees with high or low pay relative to their performance scores. This pay-for-performance disconnect is illustrated in the chart below by the scatter points within the shaded squares. The bottom line is this: if you don’t see a tight distribution of data points along the regression line, something may be amiss.
- Comparison over time — Are individual salespeople earning more or less incentive pay vs. that from prior years? If so, does individual performance outcomes explain the difference in incentive payouts or is something else going on. To help determine this, add individual performance results for the same time periods to determine if payouts and earnings over time follow the same trajectory or if they are misaligned.
Next Steps
While these three categories of analysis can help build a case for change or confirm your plan is on track, you’ll likely need a more holistic review of the company’s sales compensation plan effectiveness to account for your firm’s unique business circumstances, which could include examining turnover rates, understanding why key regrettable departures occurred and exploring non-compensatory practices that should be maintained, augmented or killed. Be careful not to lapse into “analysis paralysis,” whereby you are so caught up in measurements or alarmed by what you find that you feel hamstrung to act on any of your findings.
If you have any questions about your sales compensation plan and want to speak to a member of our compensation consulting group, please write to consulting@radford.com.
Related Articles