Following the latest set of quarterly earnings results from major banks, it’s clear that there is a renewed focus on cost management. Prior to the results, analysts closely studied how banks are performing on costs, with some banks announcing or reiterating forward guidance on efficiency ratios. As we near the end of the economic cycle and macro risks continue to emerge, we anticipate that this renewed focus on cost will only intensify. Across our own client base, we are seeing heightened activity around assessing support costs.
This article focuses on support functions, which, on average, cost an organization 30% of total group revenue. However, within these support functions, there are still substantial savings opportunities that can certainly move the dial on a bank’s efficiency ratio. Our analysis estimates that improving efficiency by one quartile against the industry standard can yield an efficiency ratio improvement of up to 6.3%—equivalent to a $1.6 billion savings for the average top 50 bank.
How much has the efficiency of support functions improved?
Post financial crisis, almost all banks have implemented some form of a large-scale efficiency program. Expense reduction levers that span support functions include optimizing procurement and sourcing, reducing non-core assets along with associated cost to serve, deployment strategy, organizational design, systems rationalization, and automation. Figure 1 illustrates the change in average absolute support costs from 2013–2017.
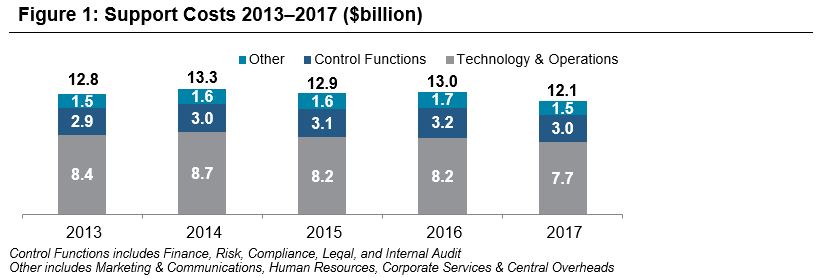
While it’s notable that costs dropped off in 2017, our data in figure 2 shows that the average cost per front office head has steadily increased by 14% over the same period.
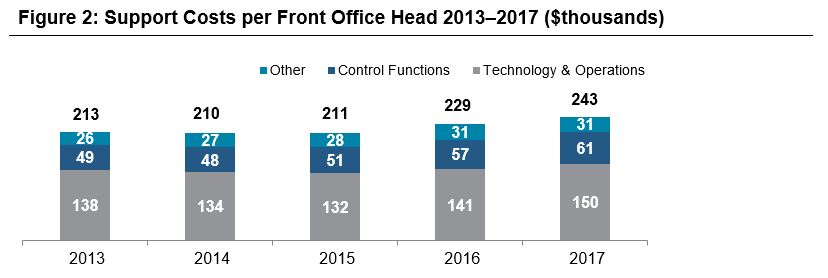
Although we would expect a trade-off between technology costs and front office headcount due to digitization initiatives, the overall increase in per head costs has been across all support functions. There are several reasons for this, such as increased regulatory and compliance demands. However, this also highlights the fact that future savings opportunities will likely target a firm’s support functions.
Heading into 2019, we expect to see a ramp up in efforts to improve cost efficiency ratios, with new programs commencing and existing ones continuing.
The evolving landscape will impact how banks approach cost
Compared to post-crisis restructuring programs, there are several key differences that impact the approach management must take when addressing cost in the current environment:
- Business mix: Fundamentally, business models and business mix have evolved, which can structurally impact the cost base. For example, within global markets there has been 29% growth since 2013 in technology and operations-intensive prime services, while advisory fees have been relatively flat. Some banks have shifted capital away from banking and markets to wealth management and others have focused on growing their technology-intensive transaction banking business. This changes the profile of support spend for many banks, blurring comparability to prior years.
- Treatment of restructuring costs: There is less forgiveness from investors and analysts on the treatment of restructuring costs as one-offs. Investors expect to see increasing returns on equity, operating leverage, and dividends. Restructuring costs have become the norm over an extended period, meaning they’re no longer one-offs.
- Digital investment: The scale of digital investment for banks is significant. On one hand, this is a powerful lever to reduce cost and enable revenue growth. On the other hand, the investment required to keep pace with disruption in the industry will weigh on cost efficiency ratios, at least in the short to medium term.
- Spend mix: Regulatory-driven change, compliance challenges and fines, automation, and business mix changes have all re-baselined certain functional spend.
- Execution complexity: Within the industry, the term “low hanging fruit” is often used in reference to cost savings achieved over the immediate post-crises era. Improving efficiency is exponentially more difficult today. Banks will need to adopt a different approach to tackling cost reduction, which will require smarter investment, as well as the need to evaluate the quality of the cost savings that they’re targeting and delivering in terms of sustainability.
- Shift to Agile: Firms are increasingly considering how they can transition into an agile organization. This is broader than just applying agile practices to project management. It means looking at revenue and costs from an entirely different lens. Firms will have to assess profitability on a transactional basis and consider the cross functional lifecycle costs attributable to a transaction. This leads to increased transparency and challenge on all expenses. However, the shift will not happen overnight. It takes time for bank reporting systems to evolve to a state that supports an agile way of analyzing financials.
How can a data-driven approach support cost optimization?
Preserving precious investment and maximizing returns on investment means making the right decisions on where to invest. Top-down targets are essential, but should always be informed by data-driven analysis. Accountability and ownership of targets are the most important factors in the success or failure of a cost optimization program. Yet, when this is not complemented with a bottom-up understanding of the cost base, program cost overruns, scope reduction, and benefits erosion are likely.
A data-driven, analytical approach to cost management can pay dividends as savings become increasingly difficult to realize. In practice, this means understanding relative performance for several cost drivers and KPIs, including:
- Compensation expenses
- Non-compensation expenses at the account level
- Spend categorization in order of criticality
- External workforce analytics
- Grade pyramids and spans & layers
- Deployment analysis
- Sub-functional comparisons
- Efficiency ratios (e.g., operating expense per revenue)
- Coverage ratios (e.g., number of support heads per front office head)
- Embedded roles (e.g., number of support staff in the front office)
- Line of business split
- Peer comparability
Understanding the gap to median, upper quartile, and best-in-class, both from an internal and external perspective, can help size opportunities. This method is particularly relevant for firms that are already best-in-class, given that the dissection of the cost base will always uncover room for improvement. In summary, adopting a data-driven approach can help management improve transparency over expenses.
Sizing the opportunity
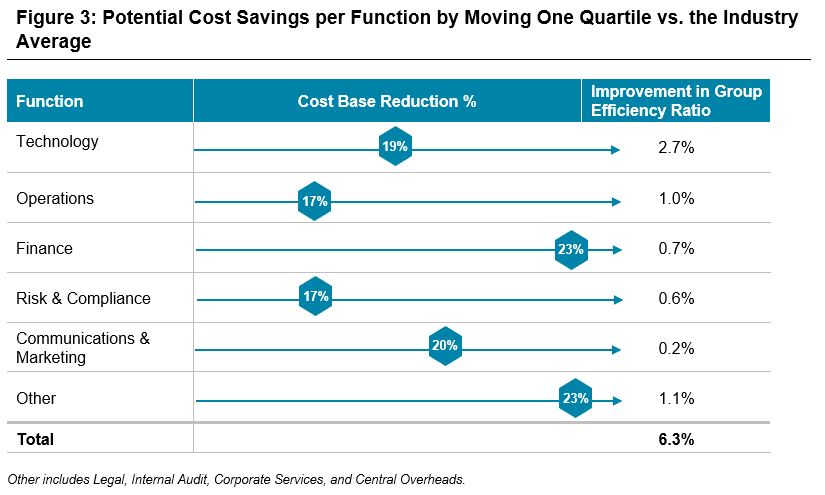
Our analysis illustrates the average cost savings banks could make from improving by the equivalent of one quartile in each support function, expressed both as a percent reduction in the cost base and as a percentage of revenue (see figure 3).
On average, improving by one quartile in each function can yield an increase in the group efficiency ratio of up to 6.3% in total. The greatest areas of opportunity lie within technology, operations, and finance. Crucially, this would provide the capacity to fund digitization, increasing compliance demands, cyber security, etc. However, banks must undertake their own tailored cost analytics—contextualized with business mix, strategy, current performance, and market relevance—to truly pinpoint where exactly savings opportunities reside. Carrying out this in-depth, yet rapid assessment is guaranteed to protect future investment and maximize return on investment.
Critical success factors
What are the critical success factors in optimizing cost, maximizing return on investment, and ensuring successful execution?
- Accountability: We’ve covered the importance of accountability earlier in this article. Top down mandates and ongoing cost forums are important in providing clear direction and ensuring accountability within business units.
- Using data to drive insights: Cost optimization opportunities should always be underpinned and validated by hard data up front. Not basing insights on facts, i.e. the actual cost per general ledger and industry comparisons with market intelligence, will lead to an erosion in savings over time, as the facts become clearer. Ultimately, this can cause an inefficient allocation of investment.
- Prioritization: Investment will always be a scarce resource and demand for investment, as well as ideas for programs of work, will typically outstrip supply. Prioritization of initiatives is imperative and should be supported by data.
- Categorization: Categorization of expenses into buckets in order of criticality avoids exhausting time focusing on cutting back critical spend, such as growth enabling investment.
- Collaboration: Adopting a cross functional, front to back approach will set cost optimization efforts up for success. The power of this method is often underestimated. Many projects require cross functional input and breaking down silos and barriers enables the right decisions to be made.
- Execution discipline: Large-scale programs can last 2+ years and will likely change considerably over their lifecycle. Therefore, management must monitor performance and proactively reallocate investment. Benefits and associated investment should be monitored, tracked, and challenged.
- Sustainability: The quality of cost savings is often overlooked. Firms need to ask themselves whether the savings attributed in return for investment are temporary or truly sustainable.
Other considerations
Allocations: In most banks, the allocation methodology is by no means perfect. Banks continue to grapple with how to best align costs to businesses and products, while business areas challenge allocations, typically failing to understand the basis and justification for allocated expenses. Analyzing and dissecting the cost base, starting with the back office where cost originates, will help isolate any noise and get to the root cause of where inefficiencies exist.
Timing: Expense and headcount analytics are often perceived as time consuming exercises. Partnering with third party experts makes comprehensive analyses possible within a matter of weeks, and benchmarking enables management to pinpoint focus areas quickly and easily.
How we can help
We work with most major banks to help carry out benchmarking and analytics of revenues, front to back costs, headcount, and capital using GAUGE financial benchmarking. Our market leading analytics and customized benchmarking have consistently enabled our clients to see where they currently stand and identify where any cost saving opportunities exist.
Specifically, the areas where we can help include:
Cost driver analytics:
- Using KPIs, such as cost per revenue and cost per capita, to identify areas of inefficiency for further investigation.
- Providing data points and analyses to uncover the root causes of cost inefficiencies, including grade pyramids, location analysis, internal vs. external spend mix, and non-compensation deep dives.
Operating model assessment:
- Comparison of peer operating models, including onshore vs. near shore vs. offshore mix, internal and external headcount, centralized vs. embedded headcount model, spans & layers, and grade pyramids.
- KPIs, such as functional heads per front office head.
- Evaluating the effectiveness of control functions.
Talent and reward analytics:
- Breakout of compensation data, leveraging our proprietary dataset, including fixed and variable pay analysis, payout ratios, and talent strategy advisory.
- Proprietary insights on geographical and functional compensation strategies and future trends.
Opportunity analysis:
- Targeting areas of improvement by dissecting the cost base by location, sub-function, and cost type.
- Drilling down into specific account lines to identify quartile deviations, even for functions or cost types that are above average at the top level.
- Quantifying opportunities based on scaled metrics.
To learn more about cost optimization for your firm, please contact our team.
Related Articles