Annual say-on-pay voting has cemented executive compensation as one of the most discussed and scrutinized governance topics. This makes it imperative that every company effectively relate their “compensation story” in the Compensation and Discussion Analysis (CD&A) section of the proxy statement. Although non-binding, a negative say-on-pay vote result can have severe (and costly) consequences for a company and its directors, including reputational damage that is not easy to reverse. To avoid these negative outcomes, many companies are focusing on demonstrating an essential cornerstone of executive pay: the alignment of pay with performance. This is where realizable pay disclosure can add immediate and effective value to a CD&A.
What is Realizable Pay?
Realizable pay is a supplemental method to calculating executive compensation. The number reflects the value of executive pay if it was earned today. Typically, this approach is a comparison between the accounting value of awards granted to executives and the current value of those awards based on the most recent share price. The goal for a successful realizable pay disclosure is to illustrate that executive compensation is linked to company performance and that pay packages are sufficiently “at-risk."
For this analysis, cash-based compensation is often unaffected by the share price, but some disclosures will determine the value of executive bonuses as of the current date. Option awards will often be valued assuming the options are exercised today (whether vested or unvested) and calculated based on the spread upon exercise. Restricted stock awards will be measured only at the current share price, but if there are performance conditions some companies choose to modify these values to incorporate the expected payout percentage for these awards.
What Are the Benefits of Realizable Pay?
In the past year, approximately 13% of S&P 500 companies have chosen to provide realizable pay as a supplement to the SEC’s disclosure requirements in the Summary Compensation Table and other proxy tables. The interest in supplemental realizable pay disclosure continues to grow since it started catching on around six years ago. Many issuers contend that mandated disclosure is not actually representative of what the executives would potentially be earning or even receiving that year.
Moreover, the accounting requirements for the initial grants of stock options and performance-based compensation are usually estimates of future potential payments, relying on a Black Scholes or Monte Carlo valuation methodology. Realizable pay, on the other hand, demonstrates how company performance is impacting the compensation value that could be recognized by their executives.
Calculating and illustrating realizable pay can provide a clear and concise way to showcase how compensation programs are working. Graphics provide a quick and easy way for investors to understand how the compensation program is performing, and ideally, make their say-on-pay voting decision an easier process. These visualizations are especially poignant for companies with recently declining share price performance or a highly volatile share price. The disparity between the intended value of the compensation granted and what will ultimately be received by the executive can become dramatically apparent. This is particularly true for performance-based compensation and option awards that are granted based on hypothetical accounting values but where the actual value will fluctuate substantially over time.
Examples of Effective Disclosure
Absent mandatory disclosure requirements for realizable pay, companies have the freedom to choose the type of chart they want (e.g., bar, line, pie chart, etc.) and the level of granularity (incorporation of multiple compensation types or a comparison to peers). Among the S&P 500 companies that disclosed realizable pay, 77% supplied data over a period longer than the last fiscal year, with three-year periods being the most common. About one-quarter of companies incorporated peer data in their analysis.
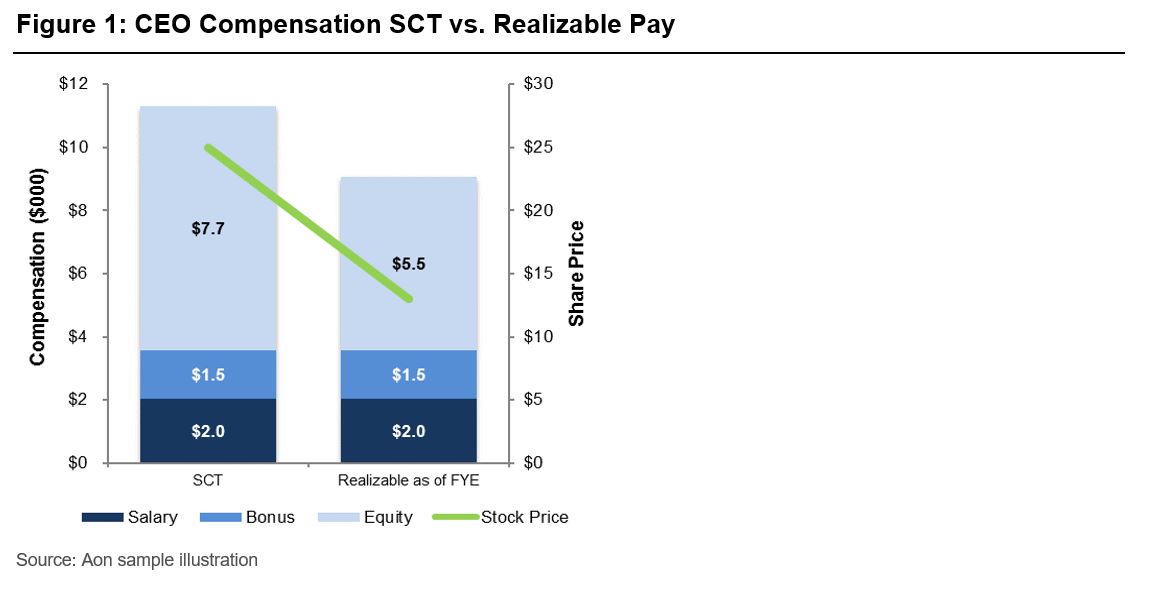
Figure 1 shows a typical realizable pay chart that we see many companies use in their proxies. The chart shows a clear example of how the CEO’s realizable pay value as of the end of the fiscal year is significantly less than what was disclosed in the Summary Compensation Table. Shareholders are able to easily see how a declining share price has greatly impacted the CEO’s pay and that pay and performance are strongly aligned.

Another disclosure technique is to measure and display compensation earned relative to a peer group. In Figure 2, a reader can see that the company is located within the “alignment corridor” of pay and performance. This type of chart will also be familiar for institutional investors that subscribe to Institutional Shareholder Services. The proxy advisory firm utilizes a similar chart for its Relative Degree of Alignment test as part of its pay-for-performance quantitative analysis.
Next Steps
The decision to disclose realizable pay in the proxy statement is only the first step. If a company decides to do so, they must then decide on valuation techniques, compensation types, time periods, whether to include a peer group comparison and if, and how, to display the data in a chart. We help numerous clients annually think through these important questions as answers will be specific to the facts and circumstances of each issuer.
If you have any questions about executive compensation disclosure or want to learn more about how we assist companies with realizable pay reporting, please contact our team.