New technology tools allow us to benchmark turnover, promotions, demotions, hiring and lateral transfers in the technology sector — unlocking important insights about your workforce.

Assessing and understanding employee mobility within an organization is essential for unlocking insights into your workforce and organizational structure. For example, high employee turnover could suggest low engagement or that someone is stealing your talent, while below average promotion rates can lead to low employee motivation or a weak bench to replace senior management. In general, employee mobility can drive both individual performance and organizational productivity.
Employee mobility measurements also reveal the inner workings of your career system and what you are going to become: Are you promoting too much and are becoming too top heavy? Are you getting too sluggish and unable to respond to change because employees just stay in place? Is your career system too chaotic because employees are jumping quickly from job to job?
Using data from the Radford Global Technology Survey, we measured employee mobility from October 2017 to October 2018 to spot patterns and benchmarks that can yield useful insights for HR leaders.
We limited our analysis to U.S.-based employees at 276 technology companies that reported data over the one-year period and tracked the following:
- New hire: Employees that were added to the organization in 2018
- Turnover: Employees that were no longer with the organization in 2018
- Promotion: Job advancement of an employee to a higher Radford job level in 2018 compared to 2017
- Demotion: Job reassignment of an employee to a lower Radford job level in 2018 compared to 2017
- Lateral transfer: An employee is moved to a completely different job but still working at the same job category and level in 2018
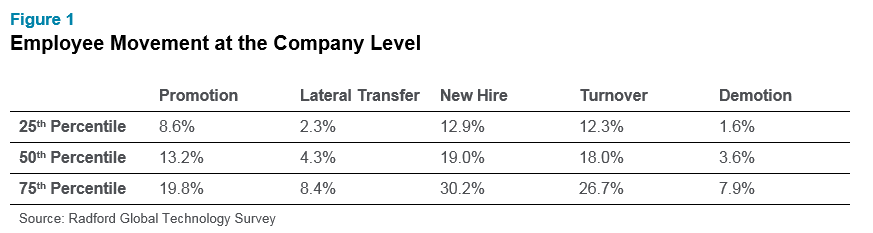
Figure 1 shows the results of this work for the selected companies. In 2018, almost half of the workforce among the technology companies changed roles in some fashion. At the median, employees were three times more likely to be promoted at 13.2% than undergo a lateral transfer at 4.3%. The headcount within our selected technology companies grew slightly from 2017 to 2018 because of a higher hiring rate (19.0%) than turnover rate (18.0%). Also, demotions are relatively rare with only 3.6% of employees moving to lower job positions in 2018.
We also looked at mobility rates within job categories. To our surprise, turnover was similar across job categories with a slightly higher turnover rate among executives at 18.2%. At the same time, executives tend to have the highest tenure, which suggests that organizations have a hard time hiring and integrating new executives beyond the core leaders that were with them for a long time.
Ascending career tracks within organizations are often like tournament brackets: Future advancements become harder and harder the higher you go. Our data affirms this as the lowest promotion rates are found among executives at 9.1% while professional individual contributors experience higher promotion rates at 12.9%.
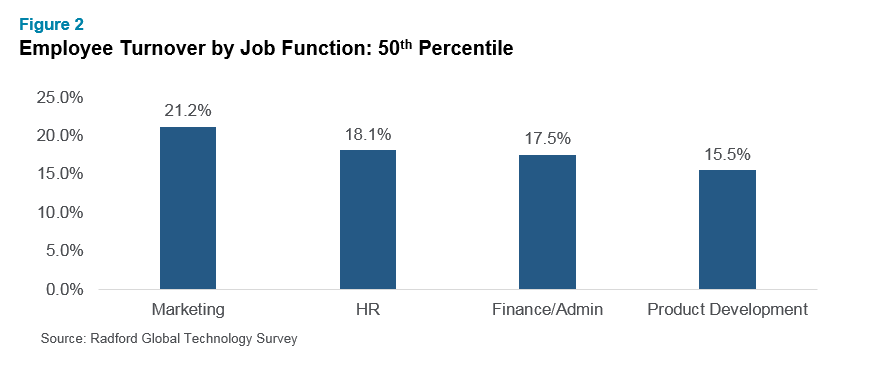
Turnover in the technolgy sector is relatively high as shown in Figure 2. Interestingly, there is more turnover in the coporate functions of marketing, HR and finance than in product development despite extremely competitive labor markets for core technical talent that comprises the product development function.
What’s Next
Overall, employee movement indicates potential issues in your organization. Examples include:
- Is our internal talent pipeline strong enough to address future workforce needs?
- Are we successfully integrating different functions and geographies in our organization through staff mobility across organizational boundaries?
- Sure, we pay enough to bring in new talent, but do we also reward them through pay and career progression?
- Are we a dynamic organization or are we becoming too static to drive change going forward?
- Does our turnover rate compare favorably with our peer group? Are there pockets by geography, job family, grade, or demographic group that indicate a turnover problem?
With our new solution tools, our people analytics team can view mobility rates in ways not possible before, including experience, tenure (e.g. new-hire turnover rates), job family, grade, location, peer group, and more. To learn more about how we can help you obtain benchmarks and uncover other important people insights using your data, please contact one of the authors or write to [email protected].