In today’s uncertain environment, many companies are actively considering new approaches to mitigate performance and payout volatility, including the use of non-financial metrics, individual performance, widening performance ranges and flattening pay curves.

Two of the most important challenges when designing short- and long-term incentives involve defining the right plan metrics and setting the range around incentive plan target levels of performance. As we approach year-end, companies will have many key incentive plan decisions to make, especially during a time of unprecedented economic uncertainty. The impact of the global COVID-19 pandemic will likely continue to cause volatile outcomes in financial and stock price performance, making it even more challenging to evaluate year-end results and set forward-looking performance goals for 2021 and beyond.
We examined the current state of incentive plan design to serve as a starting point for executive compensation professionals and boards as they make key decisions on overall plan design this fall. The information in this article is based on Aon’s Compensation and Governance Professional (CG Pro) proxy database. We looked at CEO short- and long-term incentive plan metrics and performance ranges, as well as the disclosure of actual performance as a percentage of target from a sample of the S&P 500. Disclosure of incentive plan design features were all obtained from firms’ most recent proxies.
Given that companies may be thinking about adding or replacing incentive metrics, our first analysis focused on reviewing the number and type of metrics used in incentive plans for specific sectors. Our findings indicate that, on average, two metrics based on financial or stock price performance are used in both short- and long-term incentive plans. Profit metrics (EBITDA, EPS, net income, gross profit, etc.) continue to be the most typical metrics used across most industries. Companies may also add other non-financial indicators to these plans, and there is an increasing trend towards using metrics to support environmental, social and governance (ESG) objectives.
The second analysis focused on the levels set around target performance for both short- and long-term incentive plans. It has long been a standard that performance ranges were set around 80% of target at threshold for achieving a minimum bonus, and around 120% of target at maximum for achieving a maximum bonus. Our findings, based on performance ranges by industry sector, show that ranges can vary and are driven by many factors, all of which companies need to carefully and thoughtfully weigh.
Setting the size of these ranges has become even more challenging, as levels are impacted by a myriad of factors including the type of metric, industry, business stage, etc. Further complicating the setting of targets and ranges is the volatility in financial and market performance that companies are facing this year due to the COVID-19 pandemic. The volatility impacting business factors, such as product markets, demand or raw material prices, may require performance ranges to have more stretch. The results of our performance ranges by industry sector should be used as a baseline external perspective for setting ranges.
This article provides additional data and information to help guide your incentive plan decisions forward and prepare for what lies ahead.
Short-Term Incentive Plans
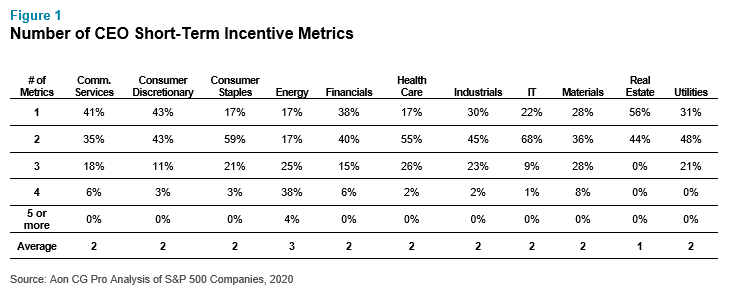
Number of Metrics by Industry
Most companies that report specific financial and total shareholder return (TSR)-based metrics use two metrics in short-term incentive plans overall. Companies may also combine financial metrics with non-financial metrics, such as strategic objectives or indicators that evaluate individual performance. Figure 1 summarizes the number of financial metrics used. All industries, excluding energy, reveal most companies use one to two metrics.
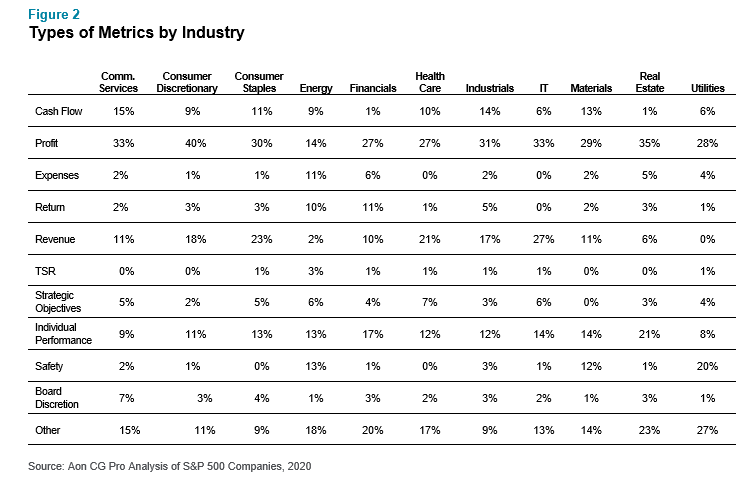
Metric Prevalence by Industry Sector
Prevalence is based on the usage of a metric in short-term incentive plans for companies in each industry sector (sample contains companies using one or more metric in short-term incentive plans). Figure 2 below shows that a majority of short-term incentive plans for companies in almost every sector primarily contain profit metrics (EBITDA, EPS, net income, gross profit, etc.). The number of non-financial metrics, strategic objectives and individual performance that are used in combination with financial metrics varies.
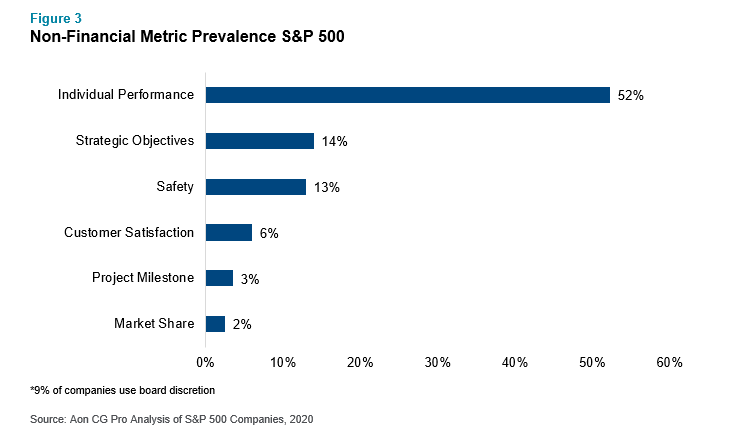
Non-Financial Metrics
Non-financial metrics supplement financial metrics and are key drivers of financial performance. Some examples may include strategic milestones, leadership, customer satisfaction and market share. For our S&P 500 sample, the top non-financial metrics in short-term incentive plans are those that measure individual performance, strategic objectives and safety.
There is a growing trend towards the use of metrics to support environmental, social and governance (ESG) objectives in short- and long-term incentive plans. Metrics that reflect employees, customers, safety, environmental and sustainability factors are all increasingly being used in incentive plans and are heavily based on qualitative assessments vs. formulaic, financial-based results.
Given the worldwide economic downturn brought upon by the pandemic, companies will have an amplified focus on supporting their workforce, as well as a heightened concern for social wellbeing. Therefore, the use of ESG metrics for measuring performance and incentivizing executives will likely continue to gain prevalence.
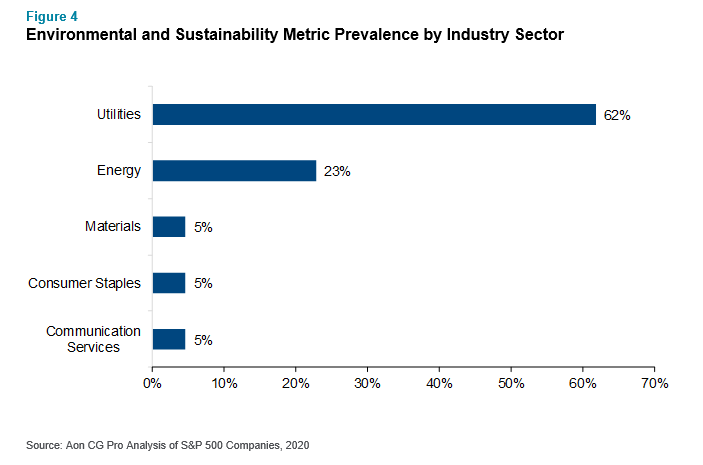
Based on a further breakout of our S&P 500 sample, we examined each type of ESG metric used in incentive plans by industry sector. Typically, these metrics were present in short-term incentive plans vs. long-term incentive plans. Figure 4 summarizes the frequency of environmental and sustainability metrics by industry sector, with the utilities and energy sectors coming in at the top. These industries typically use metrics related to safety.
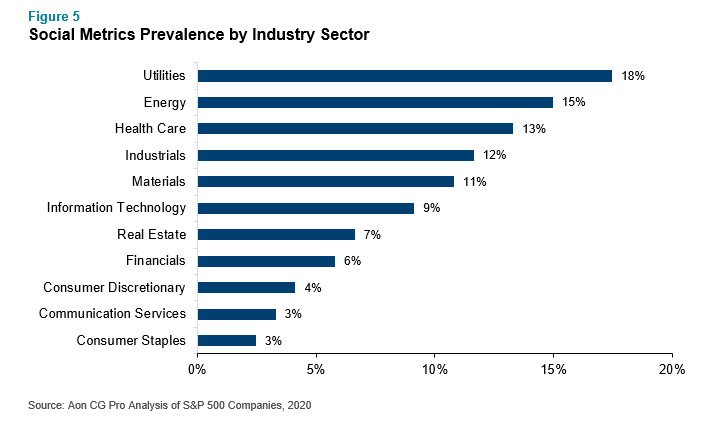
Social metrics consist of a variety of employee safety, customer, human capital and diversity-related metrics. Figure 5 shows that these metrics are very dispersed across industry sectors. The top three sectors using social metrics are utilities, energy and health care.
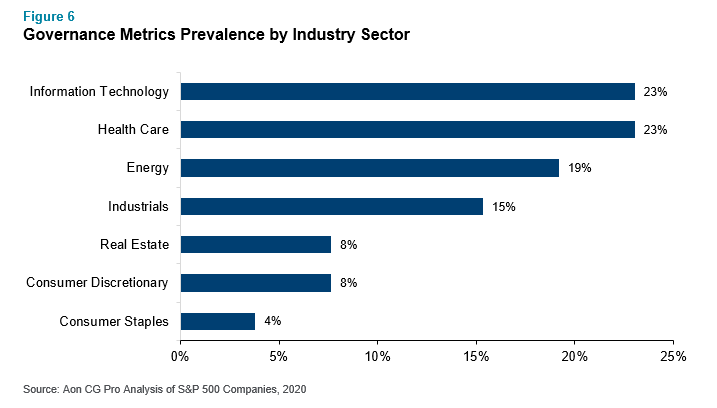
Governance metrics are typically related to effectiveness of succession planning and management development. As Figure 6 depicts, the top three sectors using governance metrics are in information technology, health care and energy.
Short-Term Incentive Performance Ranges
Performance ranges reflect the desired relationship of pay for performance above or below the target level of performance. Most often, firms specify a minimum or threshold level of performance for which payouts are delivered. Performance below this point results in a zero payout. A maximum level of performance vs. target is provided for superior performance, and this establishes the level at which incentive payouts are capped.
Performance ranges may vary based on the metrics used or industry sectors. For sectors that are more impacted by the volatility of various inputs (i.e. product markets, raw material prices) on financial performance, the range may be wider.
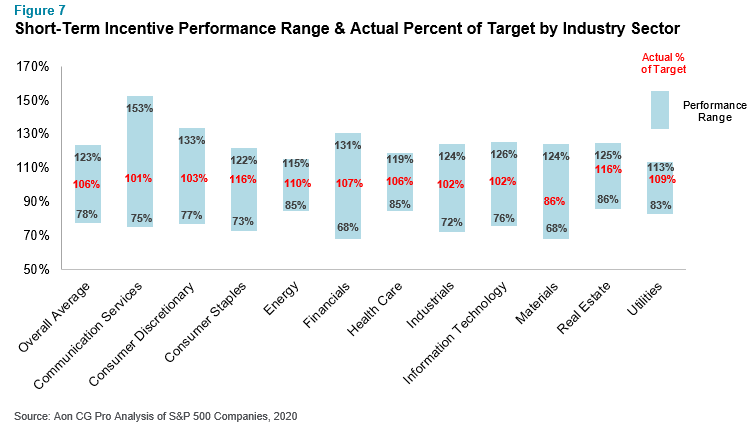
Based on average results, our sample of S&P 500 companies have a threshold of 78% of target and a maximum of 123% of target (see Figure 7). The average actual performance as a percent of target across all industries is 106% of target. The top three sectors with the widest range were communication services, consumer discretionary and financials. The three sectors with the narrowest range were energy, healthcare and utilities.
Most sectors had actual performance that was 100% or higher of target. Only the materials sector had a below 100% actual achievement as a percent of target of 86%. The consumer staples and real estate sectors had the highest actual performance as a percent of target at 116%.
Long-Term Incentive Plans
Number of Metrics by Industry Sector
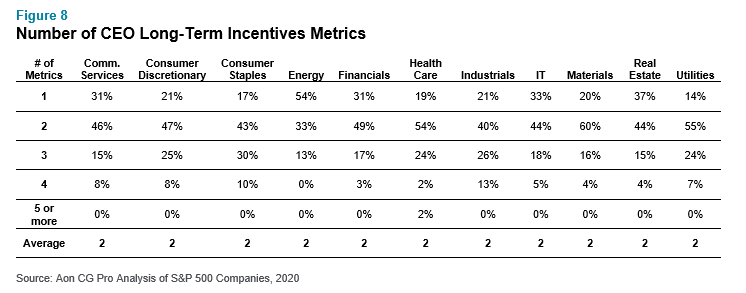
Across all sectors of the S&P 500, companies, on average, use two metrics for long-term incentives (Figure 8). The energy sector shows 54% of companies using only one metric.
Metric Prevalence by Industry Sector
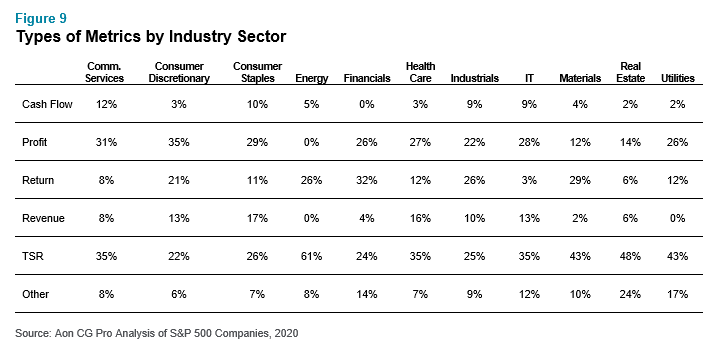
Although the metrics used by S&P 500 companies for long-term incentive plans vary widely, as seen in Figure 9 below, all sectors primarily use profit (e.g., EBITDA, EPS, net income, gross profit, etc.) or total shareholder return. Other metrics, as reflected by non-financial metrics, strategic objectives or project milestones, are not prevalent in long-term incentive plans.
Given the expected difficulty in setting goals for 2021, we anticipate that companies will increase their use of relative TSR.
Long-Term Incentive Performance Ranges
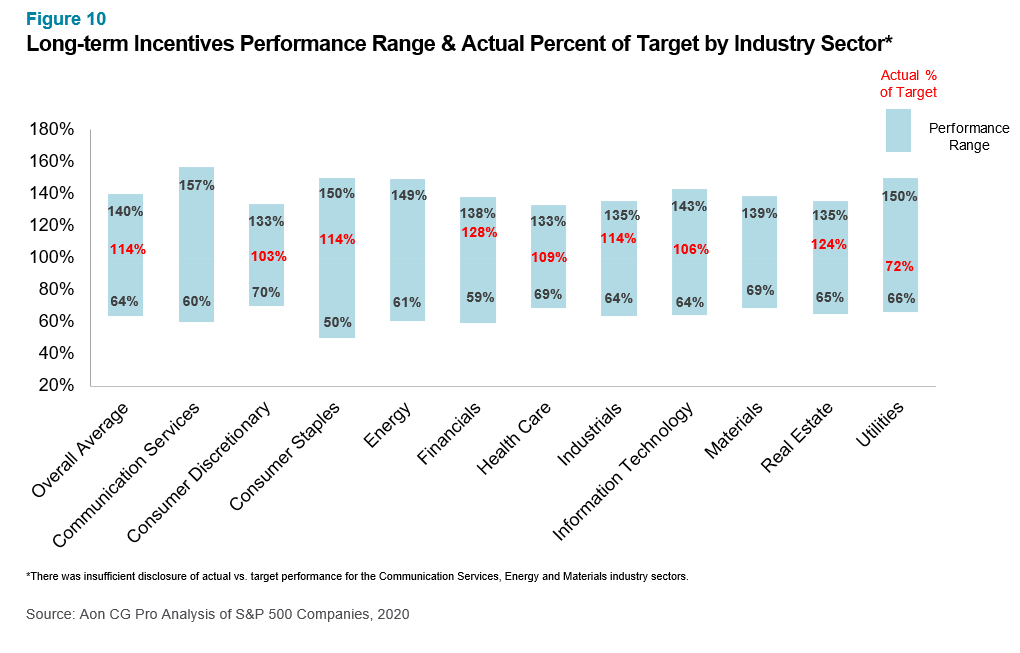
Figure 10 summarizes the long-term incentive performance ranges and actual performance as a percent of target by industry sector. For relative TSR plans, the performance range and actual performance as a percent of target is based on achieving the 50th percentile relative to peers.
Based on average results, our sample of S&P 500 companies had a threshold of 64% of target and a maximum of 140% of target (Figure 10), which exhibits a much wider range than short-term incentive plans. The average actual performance as a percent of target across all sectors is 114% of target.
The top three sectors with the widest range were communication services, consumer staples and energy. The sectors with the narrowest ranges were consumer discretionary, health care, materials and real estate.
All sectors had actual performance that was higher than 100% of target, except for the utilities sector (72% of target). The financials sector had the highest actual performance as a percent of target at 128%.
Next Steps
Given the uncertainty at year-end, it is critical to consider approaches that lessen the impact of business volatility. For incentive metrics and goal-setting, some companies are considering approaches to mitigate performance and payout volatility, such as using non-financial metrics, individual performance, widening performance ranges and flattening pay curves.
Reviewing industry and peer performance metrics and ranges is an important first step in evaluating current incentive plans and any potential modifications. It is also important to consider the unique circumstances of your business and industry and the impact that the COVID-19 pandemic has on go-forward decisions for your employees’ short-term and long-term incentive plans.
With CG Pro, a variety of tools to analyze pay and performance curves is available to conduct this review and provide key insights from a market perspective. The details provided by this database in terms of capturing the full threshold, target and maximum performance and payout levels by metric enables firms to focus more on the added complexities in the design and development of pay and performance curves.
If you have any questions for our executive compensation experts or would like to know how Aon and CG Pro can help your organization design better incentive plans, please write to [email protected].
Related Articles