There is no one-size-fits-all approach for how to best scale sales organizations for private software companies, but there are benchmarks and proven approaches to scale cost-effectively.

A key ingredient for just about any company with a hot business-to-business product that needs to scale fast is to have salespeople who are engaged, productive and ready to deliver. To that end, sales leadership often draws upon a combination of instinct and experience to determine the quantity and types of jobs that need to be filled at various stages of the company’s growth. Finance and HR leadership may view this approach as somewhat ad hoc or even chaotic, with multiple requests for approvals of job requisitions and candidate offers. However, staying on top of this process should be a priority for any leader who is accountable for sales growth by ensuring the timely and cost-effective acquisition of sales talent.
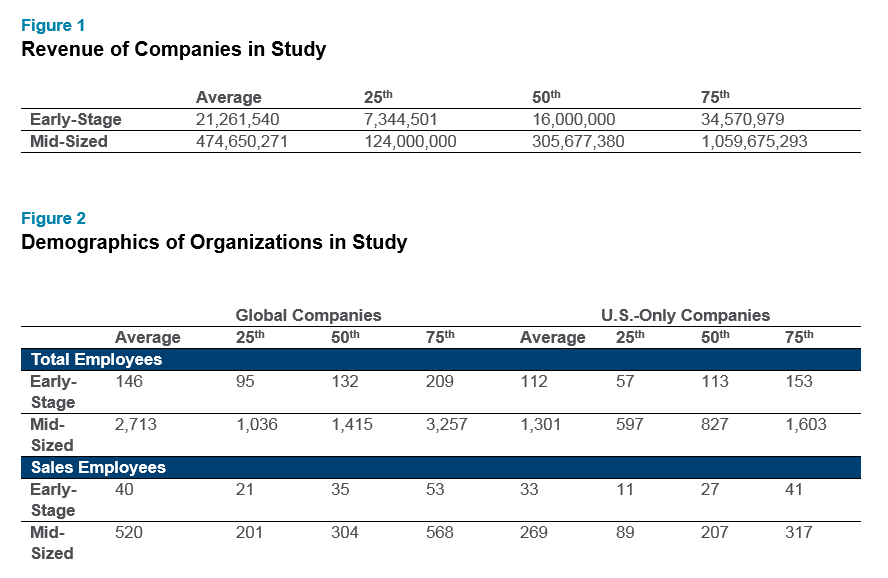
This article references organizational sizing norms for privately-held SaaS companies, from early-stage to mid-sized, using data from the Radford Global Sales Survey and our Global Workforce Analytics platform. For this study, we evaluated sales headcount, spend and revenue statistics for 106 private software companies. We segmented these companies into two groups based on total employee count: early-stage and mid-sized. The table below provides baseline statistics for both groups.
All 106 companies in this study use Radford’s global job architecture, which is our standard for profiling and valuing jobs used in the technology sector. The insights drawn from this research are also augmented by our decades of experience working with HR, finance and sales leaders in early, mid-stage and high growth technology firms as well outside industry research.
Sales Management Structure: Striking the Right Balance
The most common sales organization design questions from HR or finance relate to sales management span of control and the number of management layers common at this stage of growth. Sales leaders tend to first load up on management, based on the presumption that reps tend to follow their managers. This approach is hard to scale, and can lead to an inefficient and top-heavy structure — one with an inordinate number of managers for the number of reps.
Among early-stage companies in our sample, the average span is five and a half directs per manager, which is less efficient than the SaaStr guideline of 8:1. The reference to layers here pertains to management; most of the companies in our early-stage group use four layers, which includes three layers of management and one of individual contributors. From the data, there appears to be too many managers for the size of the salesforce.
Three factors suggest relative inefficiency of sales management structure:
- No formal distinction between managers and directors: While typical market practices distinguish between a first- and second-level manager (titled “manager” and “director,” respectively), many companies promote managers to directors yet keep them functioning as first-level managers.
- Use of “player-coaches:” This is a hybrid job that’s both manager and individual contributor, responsible for leading a team of reps and covering territories/accounts independent of the team, and classified (correctly) as a manager. While the situation is often unavoidable in small teams, particularly outside of the U.S., incumbents tend not to function well as managers, particularly when the incentive plan motivates individual performance over team performance.
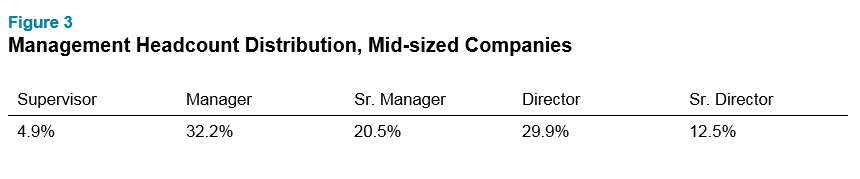
- Legacy of sales-leader emeritus: This can include former founders or employees who were leaders with their previous companies and joined the current firm as individual contributors, with the expectation that company growth will eventually require their leadership skills and warrant their leadership-level pay. The company classifies them as people-leaders, but they function as individual contributors.Ideally, as the company matures, sales headcount at both the executive and the managerial levels becomes more efficient and stratified across multiple career levels, with a lower share at the top executive and management levels, and more in the mid-to-lower executive and management levels, to enable career development.
Inside vs. Field Sales: Which Makes Sense?
The organization’s fourth layer, made up of individual contributors, is at early-stage comprised predominantly of account executives. This can be a field- or inside-based role, as required the market or customer segment served, and is responsible for closing new business from targeted accounts.
The 2018 KBCM SaaS survey reports that companies with a median ACV of between $25k and $50k have about half of the salesforce that’s field, and the bulk of the remaining share that’s inside.
While a relatively low average ACV and small-to-mid-sized business (SMB) segments typically require inside sales, and enterprise segments field sales roles, within the commercial segment is a mix between the two; the mix of inside-to-field AEs can have a considerable impact on cost and productivity. In our early-stage sample, the median cash compensation of a fully-ramped and experienced inside rep was 65% of a field equivalent, but the median annual quota only 55% of that for the field.
Whether to use inside versus field reps is a function of the company’s go-to-market; lower-cost, simpler solutions sold into a small-to-mid-sized segment of customers warrant a lower-cost sales resource. However, data from the early-stage group show a poor correlation between the share of a company’s reps that are field-based, and the average revenue per rep. The mid-stage group shows a stronger correlation.
Hunters, Farmers and Sales Development: When to Specialize
As the company scales from early- to mid-stage, so too does the diversity of customer-facing roles. In the early-stage sample, nearly 80% of the field-based incumbents appear as AEs. The AE’s mission is to hunt for and land new customers – succinctly termed “logos” – and then move on to the next new-logo opportunity.
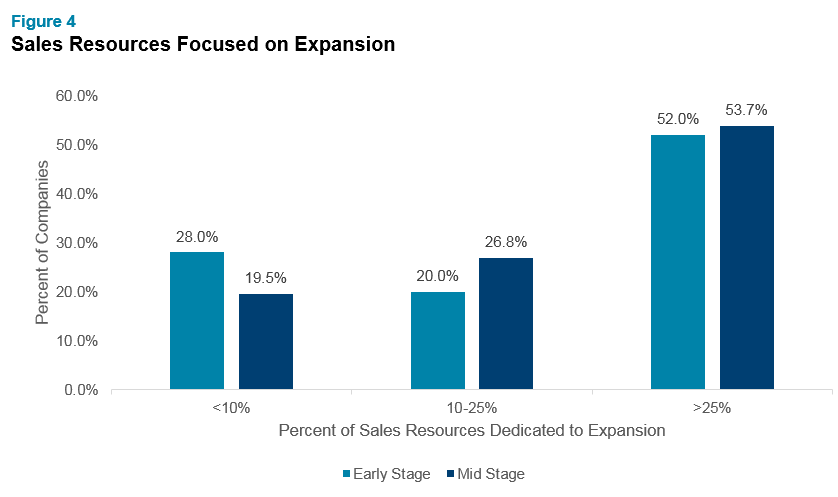
McKinsey research suggest that companies devoting between 10% and 25% of their sales resources to expansion, through farmer-type roles, do best in the land-and-expand model. Applying this benchmark, 20% of the early-stage companies fall within range, with 28% of companies having less than 10% farmers. Of the mid-stage companies, 27% are in the range, while 20% are below. As shown below, mid-stage companies tend to have a higher percentage of the sales org in farming roles, and data from both groups of companies suggest too little of an investment on hunting for new logos.
In smaller organizations, it’s more likely that reps in hunter roles gravitate to farming if the company lacks clear rules of engagement between sales, customer onboarding and success functions. While leadership may believe they have a high share of the salespeople who are hunters, in practice the share could be far lower.
Early-stage firms tend to use a relatively-high share of sales development reps (SDRs). The SDR qualifies inbound and outbound leads to help the more-expensive hunter sales roles focus on lead conversion. In the early-stage sample, companies designate 28% of the individual contributor salespeople SDRs. As the company matures, SDR headcount typically becomes less prominent relative to the share of hunter-type AE sales roles, due to the company’s adoption of technology that increases SDR effectiveness.
The metrics for determining when to specialize across these three roles in a SaaS model include:
- Churn: When true hunters focus exclusively on landing new logos, the organization depends on other representatives to ensure the customer, at a minimum, uses the solution and the experience is such that continued use is imminent. When consumption falls or stops completely, there’s a gap in the coverage that could warrant farmer-type roles, such as account managers or customer success representatives. According to the KCBM Technology Group Private SaaS Company Survey, the median, annual net dollar retention is 102%, and logos lost 11%.
- New logo and upsell rate: Ideally, the customer expands its consumption of the solution by licensing more seats or adding new functionality, or both. While hunters can and often do play this role, the risk of them becoming farmers decreases if there’s a dedicated farmer that works exclusively with existing accounts. Thus, if the rate of new logos stalls, it’s a sign that hunters need to refocus in a way that does not impact churn. Dedicated farmers should be accountable for upsells — or expansion — with quota and incentive pay being a common mechanism for motivating farmers accordingly. KCBM reports a median upsell and expansion rate of 20-45% of ARR; mid-stage companies tend to have a higher expansion rate.
- Customer acquisition cost: SDRs can play a pivotal role in reducing the amount of AE time spent on lead validation. That’s why many start-ups scale this part of the sales org early. Without an SDR function, too many leads don’t materialize into viable new-business opportunities; too many good leads don’t get a timely response; and AEs spend too much time on unqualified leads at the expense of time on qualified ones. All of this will contribute to excessive customer acquisition cost. There are diminishing returns, of course, if there are too few opportunities for SDRs to qualify. When the company is spending above 80% of its revenue on Sales and Marketing, KCBM reports, there’s likely to be diminishing returns on the company’s organic ARR growth rate.
Who Should Get Paid on a Deal?
We often observe finance and HR management being critical of the number of people paid on a single deal. Making sense of this should be relatively straightforward during the early stages of growth.
Sales management, SDRs and technical sales engineers (SEs) are the most common “overlay” jobs. Overlay jobs don’t have unique quotas; sales reps carry the quota associated with overlay jobs. If the aggregate of sales rep quota isn’t enough to cover the total cost of reps and overlays, then the company needs fewer overlays or more reps (or more time for productivity to warrant the go-to-market approach).
While our early-stage baseline shows 3.5 reps to every SE, organizations selling a mix of software and hardware and/or more-complex solutions typically need a higher share of technical sellers; 1-to-1 isn’t uncommon for these types of firms. Whatever the case, the addition of SE, management and SDR headcount assumes incremental productivity gains that more than cover the incremental cost.
As the sales organization scales, the number of overlay roles tend to as well. Overlay incumbents make up 52% of the total in mid-stage companies, up from 49% in the early-stage group. Complicating matters is the quota and incentive approaches aren’t standard within the industry for some jobs like customer success, channel development and account managers, product specialists and renewal reps. The number of individuals paid directly on a single deal can easily exceed six or ten, even in a relatively-small organization. The number can vary for two companies with the same go-to-market approach, simply because of incentive plan methodology and plan eligibility rules.
The metric for helping to keep cost-effective scale in check isn’t the number of people paid on deal. What’s more important is the compensation expense as a percent of sales, and the trend of sales incentives as a share of sales since these data tend to fluctuate more readily than base pay and corporate-type bonuses. Companies in the mid-30% on this metric are in the upper quartile of Radford’s Private Software company database.
Another overlay function is sales operations. Here the rule-of-thumb is one sales operations resource for every 30 to 50 sales reps. There are scale economies for larger organizations as well as for those having successfully leveraged automation for core tasks such as account and territory coverage, quota allocation and management and sales compensation.
Our data show that indeed, larger organizations tend to better scale sales operations headcount.
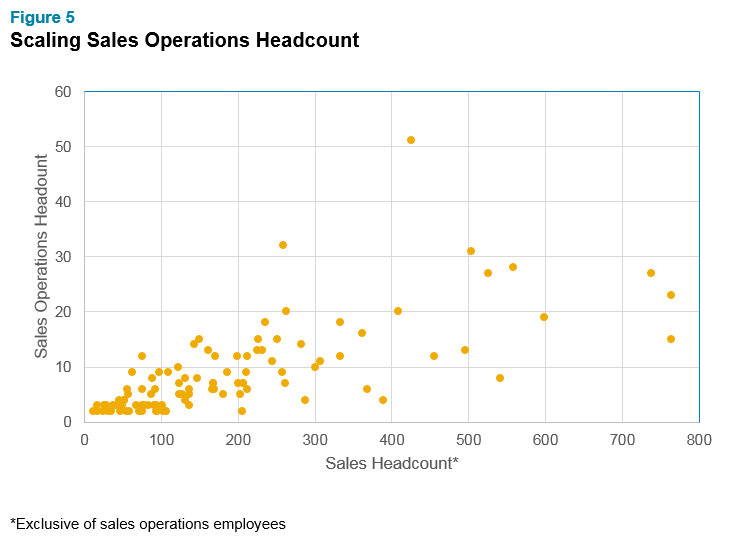
However, we observe that apples-to-apples comparisons between companies on sales ops headcount can be misleading. Some companies leverage finance personnel for capabilities that reside within another company’s sales ops department, and other companies tap consultants or contractors to support sales ops initiatives.
Look at the Big Picture First
Sales, Finance and HR leadership should agree on the methodology for measuring key performance indicators, such as growth, sales and marketing expense-to-revenue, commission expense to sales, customer acquisition cost, upsell rate and customer churn. Once agreeing to the measurement approach, this cross-functional team should evaluate the quarterly trends against a set of competitive benchmarks to determine any needed actions for boosting productivity and/or reducing cost. If, for example, the team observes a problematic trend in sales and marketing expense as a percent of new, annual recurring revenue, it should investigate the roles accountable for new customer acquisition, as these roles tend to generate the bulk of the expense. If, on the other hand, the team sees that customer churn is trending high, then it should consider focusing on the roles accountable for customer retention and contract renewal.
The next step is to use a global, or enterprise-wide, job architecture and to map employees to this structure. Radford’s global job architecture, used by over 3,500 companies, provides a standard for mapping jobs and career levels to pinpoint competitive rates of pay, headcount and cost ratios. Radford’s consultants have worked with hundreds of fast-growth technology companies at various stages of growth to guide decisions critical to sales headcount planning. These are valuable resources for making sure that companies can scale responsibly.
To learn more about participating in a Radford survey, please contact our team. To speak with a member of our compensation consulting group, please write to [email protected].
Related Articles